Quarterly Personal Health Budget Data Analysis Q3
Like many in the sector, we welcomed Sajid Javid’s speech on 8th March 2022 in which he reasserted the Government’s commitment to Personal Health Budgets (PHBs). It followed the publication by NHS Digital of PHB statistics for the third quarter of 2021/22. The headlines reported were:
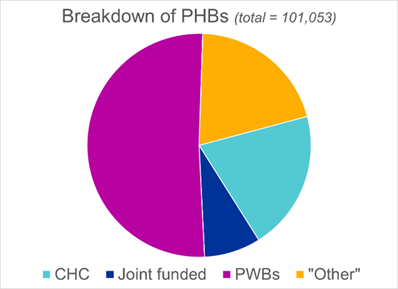
- 101,053 people received a PHB in Quarter 3.
- This represented an increase of over 25% on Quarter 2.
- 23% of PHBs were delivered as direct payments.
These statistics are impressive, and CCGs & the PHB leads within them must be applauded for keeping the PHB train on the rails during the last two years. That said, we know from our conversations with those PHB leads that making progress is sometimes challenging.
We have undertaken some analysis of the data returns, and our key observations are:
1. What is included in the statistics is quite broad – The data indicates that there were 66,888 ‘live’ PHBs at the end of Quarter 3. The difference between that number and the 101,053 quoted seems to be one-off PHBs or those PHBs that have ended during the year, but still rightly count within the YTD total. This might also explain why the proportion of PHBs delivered as direct payments has fallen from 28% in Quarter 2 to 23% in Quarter 3.
Analysis of the YTD total of 101,053 indicates that over 50% relate to personal wheelchair budgets and a further 20% relate to ‘Other’ PHBs (see observation #3).
The NHS Digital data collection guidance states that a personal wheelchair budget “can count as an ongoing PHB if annual reviews are being done”, so CCGs are not misreporting. However, if an alternative definition were to be applied (e.g. those PHBs with a recurring & regular funding stream), the data would indicate there are between 30,000 and 50,000 such PHBs nationally.
2. Comparison between CCGs needs caution – The absolute number of PHBs in a CCG can be a red herring, as some CCGs have a population that is 10 times larger than other CCGs. For example:
- A CCG in the North West ranked 48th nationally on total PHB numbers but 7th once population is factored in.
- A CCG in London ranked 10th nationally on total PHB numbers but 53rd once population is factored in.
This is an area we intend to explore further when Quarter 4 data is published.
In addition, despite the robust guidance from NHS Digital, there may still be some inconsistencies in how CCGs are reporting their data. For example:
- There are 20 CCGs that report no personal wheelchair budgets at all (with 7 of these reporting no ‘Other’ PHBs either). By contrast, there are 19 CCGs where personal wheelchair budgets comprise 80% or more of their total number of PHBs. There will be valid and genuine reasons for this difference, but it does mean that caution must be exercised when interpreting the headlines.
- Roughly half of CCGs report a ‘total’ number of PHBs that is the sum of their submitted numbers in each sub-category, whereas the totals for the other half of CCGs do not correlate to sub-categories. Both approaches could be valid, but again, it does not aid direct comparisons.
3. ‘Other’ PHBs would benefit from more analysis – The data indicates that ‘Other’ PHBs account for 20% of the reported total number of PHBs. The question asked is “How many other adults not included in the sub categories above had a personal health budget in the YTD?”. The interesting thing is that just four CCGs account for nearly 80% of ‘Other’ PHBs:
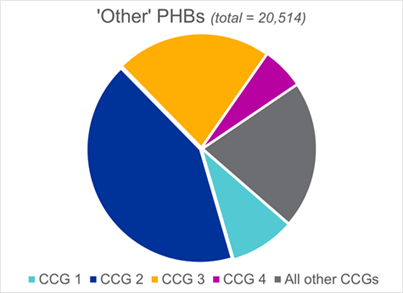
Roughly half of these ‘Other’ PHBs are flagged as being direct payments, so it is worth trying to understand what these relate to. NHS Digital’s data collection guidance states that there are six key features that need to be in place to count as an ‘ongoing PHB’. Based upon our review of Freedom of Information Request responses from some of the CCGs that account for a high proportion of the ‘Other’ PHBs, it would seem that this guidance may be being interpreted differently by some CCGs, causing some of the data to be skewed.
We hope that this analysis provides PHB stakeholders with some insights into what the numbers behind the headlines mean, and reassurance that they aren’t behind everyone else. A continued focus on this will improve the consistency of reporting to help people make more informed decisions.
If you would like to informally discuss any of our analysis, or understand how PPL can help deliver you deliver PHBs, please get in touch.