Direct Payments Analysis 2021/22
NHS Digital publishes data collated from local authorities on direct payments annually. Below are some key observations from the data published for the 2021/22 year.
The number of direct payments has fallen in each of the last six years
The number of direct payments in England peaked at just under 130,000 in 2016/17 and has fallen by 10% since then. Over the same period the proportion of people who accessed long-term support who were receiving a direct payment fell from 28.3% to 26.7%.
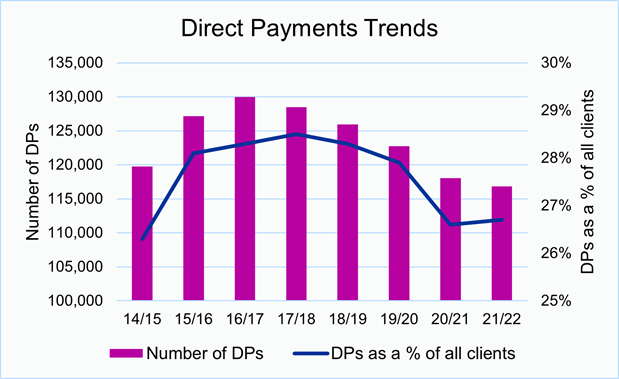
The reduction is consistent across all the regions, with the exception of the North West, which showed an increase in that period. Indeed, the downward trend is not universal: whilst 18 local authorities had a reduction in direct payment numbers of 30% or more, there were 16 local authorities that bucked the overall trend and had an increase in direct payment numbers of 30% or more.
The question that arises from this observation is 'have direct payments stalled in some places, and if so why?' Some possible answers to this include:
- Covid: The pandemic will have had an impact on the 20/21 and 21/22 numbers, but this cannot be the whole answer as numbers were falling in the three years before the pandemic and some local authorities have managed to increase direct payment numbers during the pandemic.
- Plateau effect: Those people that proactively wanted and felt able to manage a direct payment were 'early adopters', and the sector as a whole has not managed to engage the wider community in order to truly roll direct payments out to the 'mainstream'.
- Shifting focus: In the early years of the personalisation agenda, significant resources were invested both nationally and locally in promoting and embedding direct payments. In more recent years, focus may have shifted to other initiatives.
- Demand: One viewpoint is that perhaps people don't really want a direct payment. A less contentious variation on this is that there is still a perception (among professionals and individuals) that direct payments are a hassle to set-up and manage.
There is a big difference in direct payment take-up by age group
At an overall level, the number of people aged 18-64 receiving long-term social care support is roughly the same as those aged 65+. However, the younger group make up a much higher proportion of the direct payments as follows:
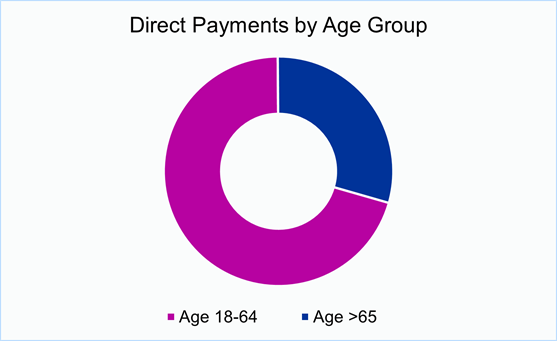
This means the 'average' local authority has 768 people with a direct payment, of which 541 people are aged 18-64 and 227 people are aged 65+.
Putting it another way:
- of the total number of people who receive long-term social care support, 1 in 4 have a direct payment.
- within the 18-64 age group, nearly 2 in 5 people have a direct payment.
- by contrast, within the aged 65+ group, just 1 in 6 people have a direct payment.
Whilst overall take-up of direct payments has fallen in the last 3 years, it has been much more pronounced in the age 65+ group (a 15% reduction) compared to the age 18-64 group (a 3% reduction). Given that the age 65+ group is likely to have a higher mortality rate, this suggests that 'new' direct payments are not coming through quickly enough to replace those that pass away.
The question that arises from this observation is 'why is uptake lower for the age 65+ group and can it be changed?'. Possible answers to the first part of the question include: the different dynamics of the cohort (and their circle of support) and associated engagement (including the 'digital divide'); and the way that third sector organisations supporting that cohort have embraced personalisation. For example, many of the (inspiring) case studies of co-production and direct payments usage tend to originate from the learning disability and physical disability cohorts. The second part of the question - of changing uptake in the age 65+ group - is more challenging. People might have previously said that it is a slow-burner and that uptake will increase over time, but this has not proven to be the case, so the sector may need to regroup if progress is to be made.
Outliers
Average uptake of direct payments is hovering around 27% across England. Regionally, the East Midlands out-performs the national average (38% uptake) whereas the North East is below the national average (20% uptake) . As would be expected, a lot of local authorities are clustered around the average, but there are notable outliers:
- There are 11 local authorities (out of 152) where direct payment uptake is less than 15%.
- There are 10 local authorities (out of 152) where direct payment uptake is more than 40% (and a handful where it is close to 50%).
The question that arises from this observation is 'why do some areas have so many more direct payments, and can this be replicated elsewhere?'. Demographics may be a factor, but a more compelling reason is likely to be local policies and practices, which can indeed be replicated elsewhere.
Next steps
The evidence on the positive difference that direct payments can make is extensive. We are passionate about promoting and supporting self-directed care and support and have a range of digital solutions to support them. If you want to promote direct payments in your area, we'd love to hear from you.