Quarterly Personal Health Budget Data Analysis Q4
NHS Digital recently published the PHB statistics for the fourth quarter of 2021/22. The headlines reported were:
- 124,964 people received a PHB.
- This represented an increase of 23,911 (24%) on Quarter 3.
- 27,103 Personal Health Budgets were delivered as direct payments (representing 22% of the total), an increase of 3,652 on Q3.
Slicing and dicing the data
Care always needs to be taken when doing comparisons. Interestingly, there were eight CCGs that appeared in the Q4 analysis that were not included in the Q3 statistics (it seems one regional group of CCGs didn’t report in Q3) and one CCG that didn’t report in Q4 . These largely cancel each other out (988 PHBs in and 678 PHBs out) and the dataset is otherwise comparable.
Is the increase in PHBs universal?
As would be expected, most CCGs are following an overall steady upward trend in PHB numbers in Q4. However, there are some outliers:
- Five CCGs reported an increase in total PHB numbers of over 100% in Q4 (together accounting for 6,161 of the net increase of 23,911 across the country).
- Eight CCGs reported a decrease in total PHB numbers in Q4 (together accounting for a reduction of 2,441 PHBs).
What is driving the overall increase?
Of the overall increase in PHBs of 23,911 in Q4, roughly 85% came from Notional PHBs & 3rd Party PHBs. This is consistent with there being 16,140 new personal wheelchair budgets in Q4 (accounting for 68% of the overall increase), which are typically Notional PHBs.
The sub-category of ‘adult fast tracks’ showed a 54% increase in Q4 (compared to the overall 24% increase across all categories). However, the majority of this increase is driven by just one CCG, implying there has been a specific, localised push and/or a reclassification.
What about PHBs as direct payments?
PHBs delivered as direct payments increased by 3,652 in Q4 (a 16% increase on Q3). Roughly 60% (2,227 PHBs) of this increase came from just four CCGs. The majority of these (1,807) sit within the ‘other’ category, being ‘PHBs not reported elsewhere’). This indicates that the underlying increase in PHBs as direct payments across all the other CCGs and/or the CHC category was modest.
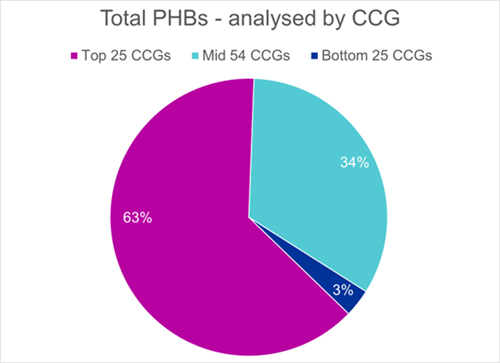
Are all CCGs equal?
As would be expected, the answer to this is ‘no’, and there are of course many good reasons for this. The ‘top 25’ CCGs together currently account for 63% of all PHBs. At the bottom of the table, the same number of CCGs (25) together account for just 3% of all PHBs.
Within the ‘top 10’ lists of CCGs for Childrens PHBs and Adults PHBs, there are five CCGs that appear on both lists, which suggests there is a degree of correlation but not absolute.
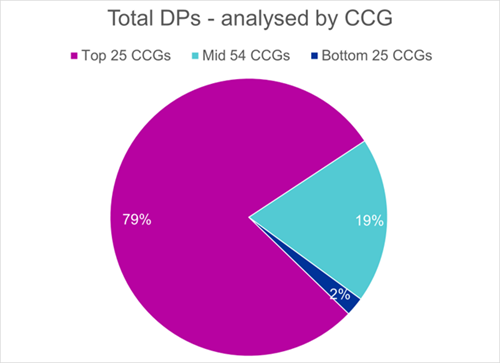
The gap between CCGs is even more marked if only PHBs delivered as a direct payment (27,103) are analysed. Here, the ‘top 25’ CCGs account for 79% (21,281) of the total.
Within the ‘top 10’ lists of CCGs for all PHBs and PHBs delivered as a direct payments, there are five CCGs that appear on both lists. Whilst the overall proportion of PHBs delivered as a direct payment is 22% across the country, the proportion within the top 10 list of CCGs varies from 99% down to 12%. This indicates that the delivery of PHBs as a direct payment is highly variable at a local level.
Which is the ‘best’ CCG?
Depending on the criteria used to define ‘best’, there are lots of different answers. Alongside the absolute numbers, the rate of growth and the relative population of the CCG need to be taken into consideration.
At present, the reports include a mixture of CCGs that have already merged and those that are transitioning to Integrated Care Boards (ICBs). It will be interesting to see how the reports for Q1 of 2022/23 are structured and the impact this may have. For example, a quick look down the lists reveals one ICB that is being formed from two CCGs that have both have very different absolute numbers but also a very different mix (5% of PHS delivered as a direct payment and 27% of PHBs delivered as a direct payment).
What about ‘rapid payment’ PHBs?
In December 2021, NHS England published guidance on the use of small, one-off PHBs to aid timely hospital discharge. These should be reported in the ‘other’ category (being PHBs not reported elsewhere). Within this category, there was an overall reduction in Q4 (largely driven by one CCG), and it is not possible to isolate what if any effect rapid payment PHBs have had. In our anecdotal conversations with CCGs, many do not appear to have made with progress with rapid payment PHBs as they are seen as difficult to implement, a problem that PPL have sought to help CCGs solve.
So what?
Overall, excellent progress continues to be made by CCGs, and we hope that this analysis provides PHB stakeholders with some insights into what the numbers can tell us.
If you would like to informally discuss any of our analysis, or understand how PPL can help you deliver PHBs, please get in touch.