Personal Health Budget Data Analysis 2022/23
NHS Digital recently published the PHB statistics for the final quarter of 2022/23. The headlines were:
- 175,859 people received a PHB.
- Of these, 30,507 were adults eligible for Continuing Healthcare
- 16% of PHBs were delivered as direct payments.
Success in increasing the number of PHBs...
The 'headline' number of PHBs reported at the end of 2021/22 was 124,964. The corresponding number for 2022/23 is 175,859 which represents a year-on-year increase in PHBs of over 40% and suggests that the ambition of 200,000 PHBs by 2023/24 is achievable.
As we explained in a previous post, the reported 'headline' numbers are based upon the total number of PHBs in the 'year-to date', which is the cumulative number of existing and new PHBs during the year and does not factor in PHBs that have ended within the period.
Based upon the detailed supporting data published by the NHS, we have adjusted the headline 'year-to-date' numbers to reflect the PHBs that have ended in a period, giving an estimate of the 'active' number of PHBs, as follows:
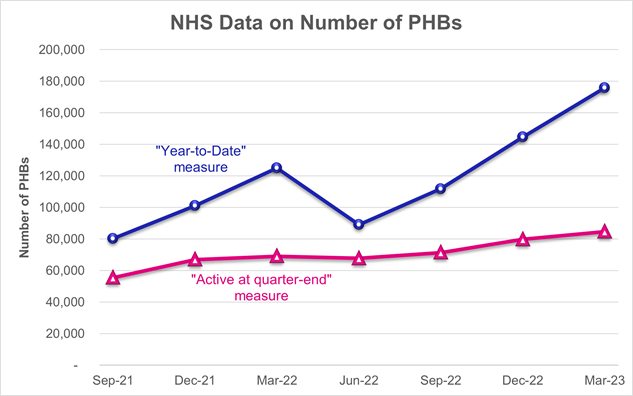
This analysis suggests that there were roughly 85,000 'active' PHBs at the end of March 2023, that growth is more modest but still represents an impressive year-on-year growth rate of 22%.
A substantial increase in notional PHBs...
The growth of 40% in the headline numbers is mainly due to an increase in notional PHBs, which now make up more than 80% of PHBs:-
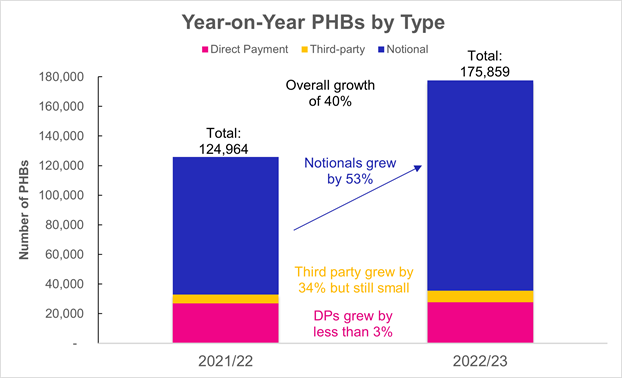
Third-party budgets grew by 34% but still make up a less than 5% of PHBs overall.
Direct payment growth is modest...
The number of direct payment PHBs increased by 2.5% over the year:-
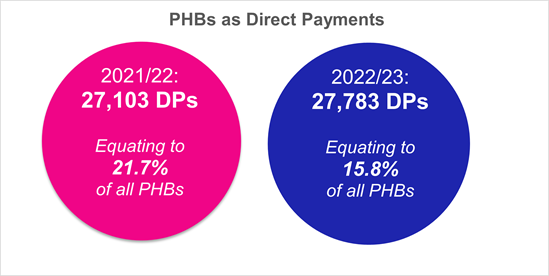
One effect of the spectacular growth in notional PHBs is that despite the absolute number of direct payment PHBs increasing (by 680), the proportion of PHBs that are direct payments has dropped notably from 21.7% to 15.8%. These findings broadly correlate with our recent analysis on direct payments in social care, where we noted that local authorities are struggling to make headway.
Direct payments are disparate...
Nationally, direct payments now make up 15.8% of all PHBs. However, the picture is not universal across the 42 ICBs. Just six ICBs together account for more than half of all direct payment PHBs (the six ICBs being: Cornwall & Isles of Scilly; Bristol, North Somerset & South Gloucestershire; Surrey Heartlands; Frimley; Devon; and Sussex, with the proportion of direct payments in these ICBs ranging from a whopping 93% to a still-impressive 38%).
At the other end of the scale, there are 19 ICBs where direct payments make up less than 10% of all PHBs. It would be useful to the sector as a whole to understand what the reasons for the disparity are.
The category 'other' deserves more attention...
Our previous commentary has highlighted that over half of all PHBs are wheelchair budgets. This remains the case for the 2022/23 figures, with the increase in wheelchair budgets (from 68,353 to 94,497) seeming to be reflective of the overall growth in PHB numbers.
However, the category 'other PHBs not counted elsewhere' has increased by over 80% in the last year (to 36,253). It is unclear what is included in this category, however, just four ICBs together account for 25,318 (70%) of these 'other' PHBs. It could be purely coincidental, but the same four ICBs have a disproportionately low number of wheelchair budgets.
Within 'mainstream' PHBs, there is an opportunity to highlight best practice...
Setting aside wheelchair budgets and the 'other' category leaves 45,109 'mainstream' PHBs. These are made up of the NHS 'headline' of 30,507 PHBs that are adults eligible for Continuing Healthcare, plus categories such as those with with a learning disability, mental heathcare needs or joint funding.
Based on our analysis, the top six ICBs for 'mainstream' PHBs are: North East & North Cumbria; Greater Manchester; Dorset; Cheshire & Merseyside; West Yorkshire; and Mid & South Essex. Interestingly, there is no overlap between this list with the list of direct payments high-performers detailed above. Again, it would be useful to the sector as a whole to understand if there are things that these ICBs are doing that can be replicated elsewhere.
A final message...
Notwithstanding all the slicing and dicing of the statistics, what is clear is that PHBs are continuing to grow. We applaud all those involved, from the top right down to the individual nurses at the coalface as one more PHB won't materially shift the statistical analysis, but it might make the world of difference to an individual and their family.
What do you think?
If you would like to informally discuss any of our analysis, or understand how PPL can help you deliver PHBs, please get in touch.