Quarterly Personal Health Budget Data Analysis Q1
NHS Digital recently published the PHB statistics for the first quarter of 2022/23. The headline was that 89,112 people received a PHB by the end of Quarter 1.
Has there been a reduction in the number of Personal Health Budgets?
The short answer is: 'yes' and 'no'! The eagle-eyed observer may recall that the 'headline' number of PHBs reported in the previous quarter (Q4) was 124,964. The corresponding Q1 number is 89,112 PHBs, which does suggest there has been a substantial decrease.
However, this is a result of how the data is analysed: the reported 'headline' numbers are based upon the total number of PHBs in the 'year-to date', which is the cumulative number of existing and new PHBs during the year. It does not factor in PHBs that have ended within the period. As the Q1 data 'resets' for a new 2022/23 year, the headlines for Q4 and Q1 are therefore not directly comparable.
Based upon the detailed supporting data published by the NHS, we have adjusted the headline 'year-to-date' numbers to reflect the PHBs that have ended in a period, giving an estimate of the 'active' number of PHBs, as follows:
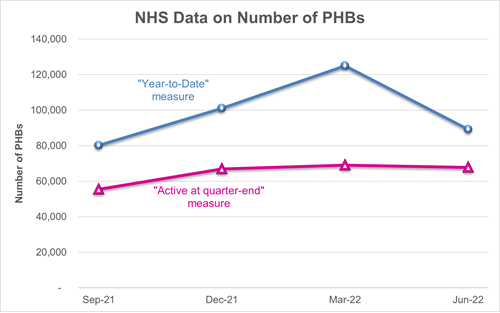 This analysis suggests that the total number of 'active' PHBs has been relatively static for the last six months, hovering at around 67,000-69,000.
It should be noted neither method of measurement is right or wrong. They both have their merits:
- The 'year to date' measure rightly acknowledges that CCGs have little control over PHBs that come to an end, and therefore recognises success in establishing new PHBs.
- The 'active' measure reflects ins and outs, and is perhaps a better comparison across different reporting periods.
What about PHBs by type?
We have previously highlighted that wheelchair budgets make up a relatively high proportion of the reported PHBs. This is clear from the Q1 data:
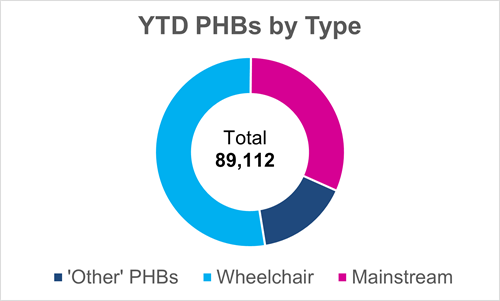 Our analysis indicates that wheelchair budgets make up 53% of the headline 'year to date' numbers of PHBs. Disregarding these, and the catch-all category of 'other' PHBs, leaves just over 28,000 PHBs (31% of the total) that we have labelled as 'mainstream' PHBs (which are generally adults or children with continuing healthcare, learning disability or mental health funding).
Taking this analysis one step further, the 'headline' number of PHBs implies that the average CCG has 841 PHBs, whereas the average number of 'mainstream' PHBs is 265 per CCG.
What about ICBs?
The data for Q1 was reported by CCG. Integrated Care Boards (ICBs) replaced CCGs from 1 July 2022, and a number of CCGs have been consolidated in to an ICB. We looked at the data to identify any potential anomalies or outliers that may have an impact when CCGs merge.
There are a few examples where one merging CCG has strong wheelchair numbers and another CCG has few or nil wheelchair budgets. However, aside from these, we found no evidence of any material differences in CCGs that are merging, especially once the relative size of CCGs is taken in to account.
What do you think?
If you would like to informally discuss any of our analysis, or understand how PPL can help you deliver PHBs, please get in touch.